Guide to the NetworkManager
Sign-in and navigate
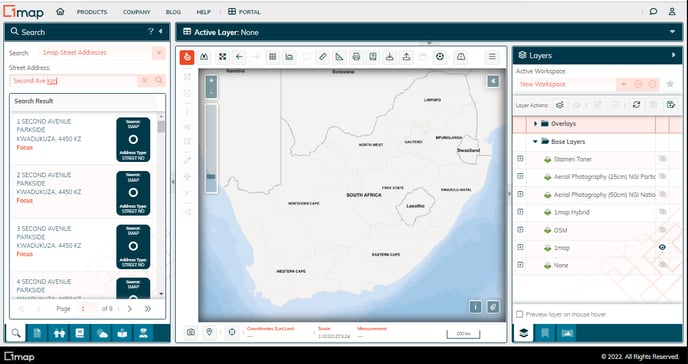
Follow this link to learn how to sign in, access the Spatial application and navigate your way around the map.
Accessing and navigating the app
Explore the data available
Layers
Once you are comfortable with basic navigation, you can explore the wealth of spatial data available to you that is managed in layers. Follow these links to learn more about layers, loading, activating, etc:
Quick Video introduction to Layers
Workspaces
Workspaces are a way to streamline your process as you work with multiple layers. Find out more about workspaces in this link:
Update your Data
Spatial Editing
Spatial Editing allows you to edit features like a line, point or polygon on the map. This could include creating or moving or the feature, changing it's boundaries, making it smaller or bigger.
Attribute editing
Attribute Editing allows you to change the data attributes connected to a map element, and this occurs in the data grid. This could be changing the name of a feature, or it's colour, or any other information about the feature that is present in the data table associated with the layer you are actively using.
Active Layers Panel
The data grid
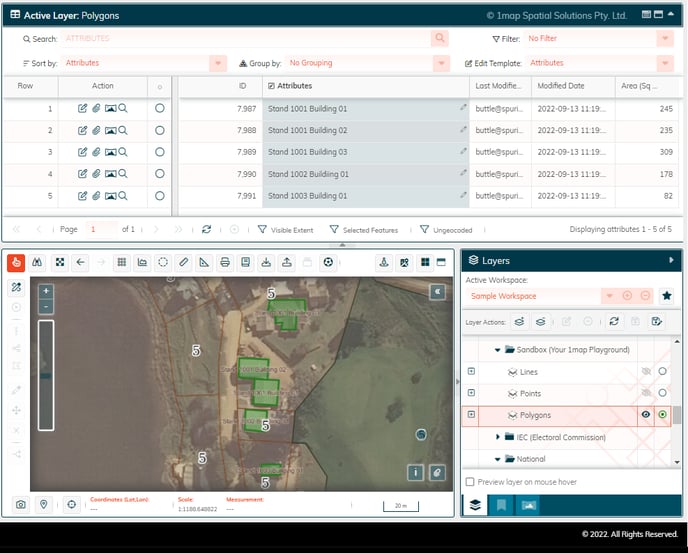
Above the centre map panel is a heading "Active Layers". Clicking any where on this heading opens the grid to reveal the data associated with the layer currently set as Active in the right Layers panel. If the word "None" appears in this heading, select a layer and make it active in the layers panel, and the data appears here. There are several functions available in this grid to sort and filter the data, as well as choose edit templates which allow an operator access to predefined fields which can then be edited directly in this grid.
In this example, the active layer has been set to Polygons (in the Sandbox group), and the data for each of the 5 polygons on the map appear in the grid:
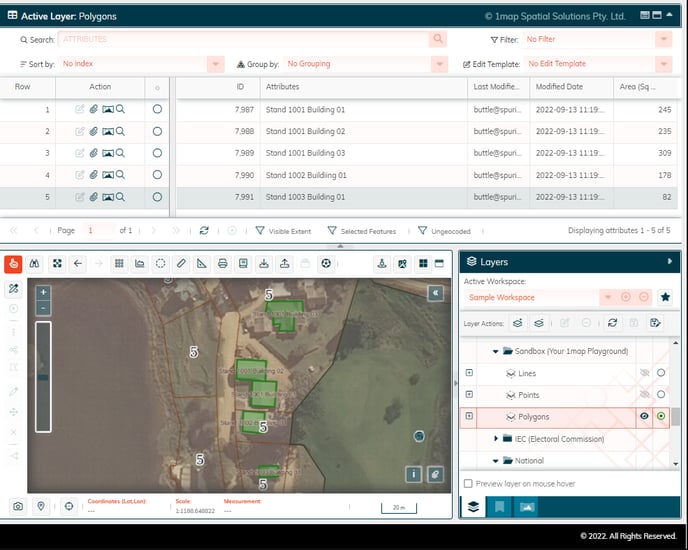
Note: If the grid is empty when you open it, check whether the "Selected Features" icon below the grid is highlighted in orange. If so click on it to de-select and the grid will be populated.
Search
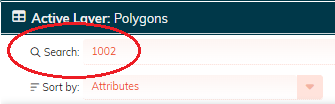
In this example, by entering 1002 in the search field, the grid display changes to show only entries where the attribute field contains that value, and the grid now displays 1 entry. Note that the entry in the grid is also highlighted in red on the map.
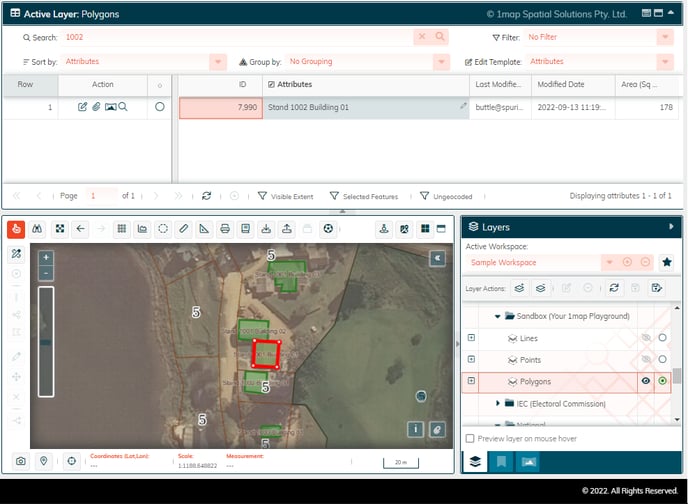
Note: Unlike the general search in the main search panel, the search provided in the Active Layer is limited to predefined fields present in the data grid. Only the fields named here can be searched. (In this example, Attributes).
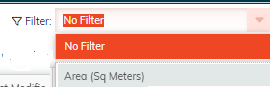
Filters
Use the dropdown on the Filter function to select from the predefined filters to limit your selection to specific entries in the grid that meet your filter criteria.
Selecting Edit Templates
Use the dropdown on the Edit Template function to select access to the predefined fields in the grid that you are permitted to edit here in real-time.
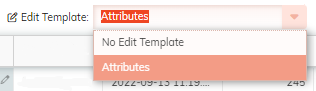
A pencil icon appears next to each field that the user is permitted to edit.
Double-click on the field to access its current data and make changes. Press enter to accept your change.
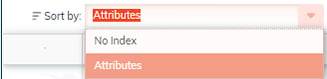
Sort By
Use the dropdown on the Sort by function to select from the predefined sorts available. In this example clicking on Area (Sq Meters) will resort the entries to display in ascending order of erf size.
Export (or download) data
![]()
The export button appears above the map and looks like a printer icon.
This opens a wizard which takes you through the process.
It is possible to extract data in either spatial format or to download an excel spreadsheet or comma delimited text file of the associated data from the data grid associated with your map layer. This link explains how to export data. To export a data file, follow the same procedure, but choose CSV File or MS Excel 2007+ (XLSX) instead of a shapefile.
Printing a map
![]()
The mapbook print button appears above the map and looks like a book icon.
This wizard can also be accessed in the left panel, the second tab at the bottom, and has the same icon.
Reports
To be defined
Utilities and Tools
A comprehensive article describing all the buttons and icons on the map interface is available here: